
ABC inventory control system
Inventory optimization in supply chain, ABC analysis is an inventory categorization method which consists in dividing items into three categories, A, B and C: A being the most valuable items, C being the least valuable ones. This method aims to draw managers’ attention on the critical few (A-items) and not on the trivial many (C-items).
Prioritization of the management attention
Inventory optimization is critical in order to keep costs under control within the supply chain. Yet, in order to get the most from management efforts, it is efficient to focus on items that cost most to the business.The Pareto principle states that 80% of the overall consumption value is based on only 20% of total items. In other words, demand is not evenly distributed between items: top sellers vastly outperform the rest.
The ABC approach states that, when reviewing inventory, a company should rate items from A to C, basing its ratings on the following rules:
- A-items are goods which annual consumption value is the highest. The top 70-80% of the annual consumption value of the company typically accounts for only 10-20% of total inventory items.
- C-items are, on the contrary, items with the lowest consumption value. The lower 5% of the annual consumption value typically accounts for 50% of total inventory items.
- B-items are the interclass items, with a medium consumption value. Those 15-25% of annual consumption value typically accounts for 30% of total inventory items.
The annual consumption value is calculated with the formula: (Annual demand) x (item cost per unit).
Through this categorization, the supply manager can identify inventory hot spots, and separate them from the rest of the items, especially those that are numerous but not that profitable.
eCommerce example
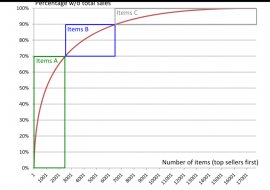
The graph above illustrates the yearly sales distribution of a US eCommerce in 2011 for all products that have been sold at least one. Products are ranked starting with the highest sales volumes. Out of 17000 references:
- Top 2500 products (Top 15%) represent 70% of the sales.
- Next 4000 products (Next 25%) represent 20% of the sales.
- Bottom 10500 products (Bottom 60%) represents 10% of the sales.
This example is fairly close to the canonical Pareto situation.
Inventory management policies
Policies based on ABC analysis leverage the sales imbalance outlined by the Pareto principle. This implies that each item should receive a weighed treatment corresponding to its class:Share this article
Related Posts


Latest Posts


