Frequency Response analysis in control system
1. Frequency Response
The frequency response method may be less intuitive than other methods you have studied previously. However, it has certain advantages, especially in real-life situations such as modeling transfer functions from physical data.
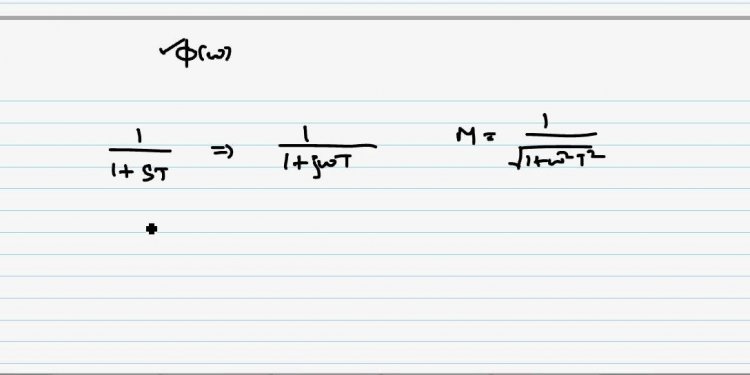
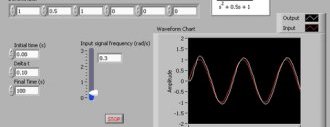
The frequency response is a representation of the system's response to sinusoidal inputs at varying frequencies. The output of a linear system to a sinusoidal input is a sinusoid of the same frequency but with a different magnitude and phase. The frequency response is defined as the magnitude and phase differences between the input and output sinusoids. In this tutorial, we will see how we can use the open-loop frequency response of a system to predict its behavior in closed-loop.
To plot the frequency response, we create a vector of frequencies (varying between zero or "DC" and infinity) and compute the value of the plant transfer function at those frequencies. If G(s) is the open loop transfer function of a system and w is the frequency vector, we then plot G(j*w) versus w. Since G(j*w) is a complex number, we can plot both its magnitude and phase (the Bode plot) or its position in the complex plane (the Nyquist plot).
 2. Bode Plots
As noted above, a Bode plot is the representation of the magnitude and phase of G(j*w) (where the frequency vector w contains only positive frequencies).
LabVIEW Graphical Approach
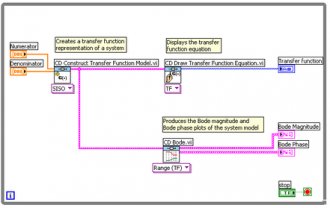
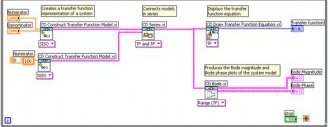
To see the Bode plot of a transfer function, you can use the CD Bode VI, located in the Frequency Response section of the Control Design palette.
Figure 1: Creating a Bode Plot (Download)
LabVIEW MathScript Approach
Alternatively, you can use the following m-file code in the MathScript Window (Tools » MathScript Window):
 num = 50;
den = [1 9 30 40];
sys = tf(num, den);
bode(sys)
Result
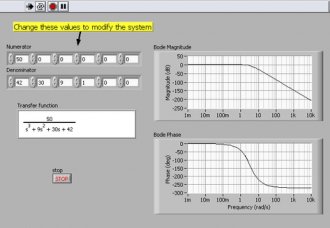
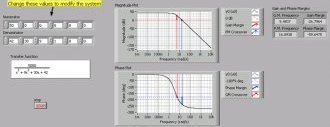
With either approach, we display the transfer function and Bode plots for the system. Figure 2 shows the front panel of the VI that was built in Figure 1. Change the terms in the numerator and denominator to observe the effect on the system’s Bode plots.
Figure 2: Bode Plots in LabVIEW
Note the axes of the plots in Figure 2. The frequency is on a logarithmic scale, the phase is given in degrees, and the magnitude is given as the gain in decibels. A decibel is defined as 20*log10 ( |G(j*w)| ) .
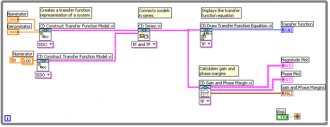
3. Gain and Phase Margin
Let's say that we have the following system:
Figure 3: A Closed-Loop System
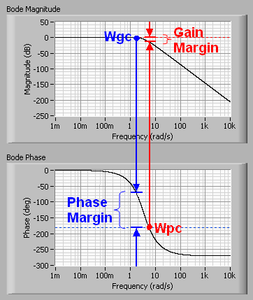
In this system, K is a variable (constant) gain and G(s) is the plant under consideration. The gain margin is defined as the change in open loop gain required to make the system unstable. Systems with greater gain margins can withstand greater changes in system parameters before becoming unstable in closed loop. Keep in mind that unity gain in magnitude is equal to a gain of zero in dB.
The phase margin is defined as the change in open loop phase shift required to make a closed loop system unstable. The phase margin also measures the system's tolerance to time delay. If there is a time delay greater than 180/Wpc in the loop (where Wpc is the frequency where the phase shift is 180 deg), the system will become unstable in closed loop. The time delay can be thought of as an extra block in the forward path of the block diagram that adds phase to the system but has no effect the gain. That is, a time delay can be represented as a block with magnitude of 1 and phase w*time delay (in radians/second).
Share this article
Related Posts


Latest Posts


