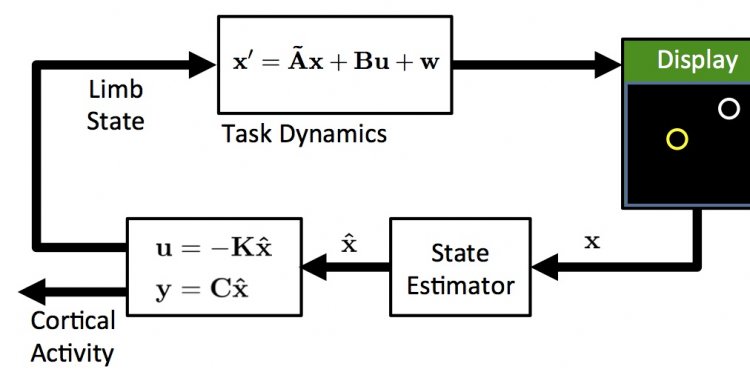
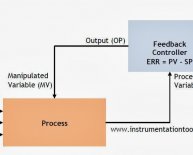
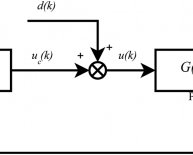
Closed loop diagram
 One very simple way of showing the parts of a system and how they interrelate are causal loop diagrams (also referred to as influence diagrams): They show the relevant parts of a system using textual identifiers, the links between the parts are drawn using arrows pointing in the direction of influence. Small + or − signs are used to show whether the influence is positive or negative (also referred to as positive or negative link polarity).
A note on notation
Sometimes an alternative notation using an s (short for same) and o (short for opposite) is used instead of the + and −. In his paper “Problems with causal loop diagrams” published in the System Dynamics Review in 1986, George Richardson discusses both notations and comes to the conclusion that it is better not to use s and o.
A simple example from every day life is to examine the dynamics of getting a set of open tasks done by a specific deadline. Creating a causal loop diagram of a given system is conceptually quite simple, even though it mostly leads to very animated discussions in practice: you start with the parts of the system you already know and just keep asking “what influences this part” until you reach parts that are at the systems boundary or parts that will not change over time. Then you go in the other direction and keep asking “What other parts does this part influence”. If that part is already there, you connect them. Otherwise, you create a new part.
The causal loop diagram displayed above shows some important aspects of what is involved in getting tasks done, we will discuss this diagram in detail to show the thinking behind it:
Let’s start with the deadline: What influences the deadline? For this simple model, we assume the deadline is set from the outside and does not change. Therefore the deadline is a constant and does not have any influencing factors – it is at the systems boundary.
Now we ask the question: What parts of the system does the deadline influence?
Well, try and think yourself into the situation: the first question you have to answer when it comes to getting something done by a deadline is: how much time have I got left? This can easily be modelled by adding a new factor “Remaining time”. The further away the deadline is, the more time remains. As discussed above, we speak of positive influence or positive polarity in this case, and we show this by placing a small plus sign next to the connector.
What other parts affect the remaining time? A little thought shows that the remaining time not only depends on the deadline, but also on the current date. As the current date moves on, the remaining time gets smaller and smaller, so we add a minus sign to the connector.
Up until now we have ignored the open tasks: What we are actually interested in here is not the work itself, but in how quickly we can do the work. One way to capture this information is to capture the completion rate. The higher the completion rate is, the faster the set of open tasks will get smaller, so we place a small minus sign on the connector.
What does the completion rate depend on? Well, we know how much time remains (measured in days, let’s say). But we haven’t said anything about the number of hours per day we can invest into getting our tasks done. We capture this information in a new part I shall call “overtime”, i.e. your workday. Clearly the more hours you put in, the higher the completion rate is going to be, we capture this information with a small plus-sign placed next to the connector.
What else does the completion rate depend on? Well, next to the number of hours you work on your tasks, there is also the question of how productively you use your hours. Do you spend every minute of every hour working on the tasks at hand, or do you use some of your time daydreaming, surfing the internet, or chatting to colleagues? Let’s capture this aspect of working in a new building block and name that “productivity”. The higher the productivity is, the higher the completion rate will be, so we add a positive polarity.
Let’s quickly review our diagram: We have captured our understanding of how tasks are affected by productivity and workday. But how does the remaining time come into this?
Well, if you are like me, then your productivity isn’t always the same, and neither are the hours you work: The lesser the time remaining until the deadline, the more productive you become and the longer the hours are that you work. We could directly connect the remaining time to both productivity and workday, but there is a term we typically use to describe this: schedule pressure. The less time that remains, the higher the schedule pressure gets. So we add a building block “schedule pressure” to capture this.
The higher the schedule pressure gets, the higher my productivity becomes; unfortunately, the same is mostly true for our workday, i.e. overtime. So we place plus-signs on both these connectors.
Now, have we captured all aspects of schedule pressure? What other factors affect schedule pressure next to the time remaining?
Well, clearly if we have completed all tasks and nothing remains to be done, the schedule pressure drops down to zero! So the schedule pressure will also be affected by the number of open tasks. If the number of open tasks goes up, so does the schedule pressure. Therefore, we place a small plus sign next to the connector.
What other parts of the system does the schedule pressure affect? One thing we might do when the schedule pressure is high is to add further resources to the project. Schedule pressure may also have an effect on the quality of our work. Both of these aspects are important and worth investigating, but we will not consider these here for now to keep the example simple.
All in all, our causal loop diagram is actually looking quite good: we have captured the essential aspects of what it takes to get a set of open tasks done by a particular deadline. All parts of the system are connected, and there are no loose ends.
We have ended up with two closed loops that feed back on themselves. This observation is important, because closed-loops mean that the situation we are analysing is a feedback system: Feedback systems have a closed loop structure that bring results from past action of the system back to control future action – so feedback systems are influenced by their own past behaviour. In this case it means that if you spend too much of your time initially procrastinating, you will be hit by very high schedule pressure the closer the deadline comes. If you invest your time wisely from the beginning, the schedule pressure won’t become too bad later one. I’m sure this is something you have experienced yourself.
Actively looking for feedback loops (“closed loop thinking”) is an important activity in systems thinking, because feedback loops are what cause a system to change its behaviour over time (and very often in unexpected ways). We differentiate between to kinds of feedback loops: balancing (or negative) feedback loops and reenforcing (or positive) feedback loops.
Share this article
Related Posts
Latest Posts


