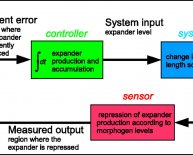
Feedback control diagram
 Components of a Control Loop
A controller seeks to maintain the measured process variable (PV) at set point (SP) in spite of unmeasured disturbances (D). The major components of a control system include a sensor, a controller and a final control element. To design and implement a controller, we must:
| 1) | have identified a process variable we seek to regulate, be able to measure it (or something directly related to it) with a sensor, and be able to transmit that measurement as an electrical signal back to our controller, and |
| 2) | have a final control element (FCE) that can receive the controller output (CO) signal, react in some fashion to impact the process (e.g., a valve moves), and as a result cause the process variable to respond in a consistent and predictable fashion. |
Home Temperature Control
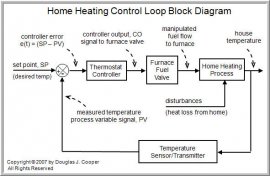
As shown below (click for a large view), the home heating control system described in this article can be organized as a traditional control loop block diagram. Block diagrams help us visualize the components of a loop and see how the pieces are connected.
A home heating system is simple on/off control with many of the components contained in a small box mounted on our wall. Nevertheless, we introduce the idea of control loop diagrams by presenting a home heating system in the same way we would a more sophisticated commercial control application.
The measured temperature PV signal is subtracted from set point to compute controller error, e(t) = SP – PV. The action of the controller is based on this error, e(t).
In our home heating system, the controller output (CO) signal is limited to open/close for the fuel flow solenoid valve (our FCE). So in this example, if e(t) = SP – PV > 0, the controller signals to open the valve. If e(t) = SP – PV < 0, it signals to close the valve. As an aside, note that there also must be a safety interlock to ensure that the furnace burner switches on and off as the fuel flow valve opens and closes.
As the energy output of the furnace rises or falls, the temperature of our house increases or decreases and a feedback loop is complete. The important elements of a home heating control system can be organized like any commercial application:
▪ Control Objective: maintain house temperature at SP in spite of disturbances
▪ Process Variable: house temperature
▪ Measurement Sensor: thermistor; or bimetallic strip coil on analog models
▪ Measured Process Variable (PV) Signal: signal transmitted from the thermistor
▪ Set Point (SP): desired house temperature
▪ Controller Output (CO): signal to fuel valve actuator and furnace burner
▪ Final Control Element (FCE): solenoid valve for fuel flow to furnace
▪ Manipulated Variable: fuel flow rate to furnace
▪ Disturbances (D): heat loss from doors, walls and windows; changing outdoor temperature; sunrise and sunset; rain…
 A General Control Loop and Intermediate Value Control
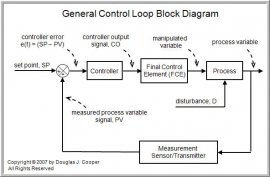
The home heating control loop above can be generalized into a block diagram pertinent to all feedback control loops as shown below (click for a large view).
Both diagrams above show a closed loop system based on negative feedback. That is, the controller takes actions that counteract or oppose any drift in the measured PV signal from set point.
While the home heating system is on/off, our focus going forward shifts to intermediate value control loops. An intermediate value controller can generate a full range of CO signals anywhere between full on/off or open/closed. The PI algorithm and PID algorithm are examples of popular intermediate value controllers.
To implement intermediate value control, we require a sensor that can measure a full range of our process variable, and a final control element that can receive and assume a full range of intermediate positions between full on/off or open/closed. This might include, for example, a process valve, variable speed pump or compressor, or heating or cooling element.
Note from the loop diagram that the process variable becomes our official PV only after it has been measured by a sensor and transmitted as an electrical signal to the controller. In industrial applications. these are most often implemented as 4-20 milliamps signals, though commercial instruments are available that have been calibrated in a host of amperage and voltage units.
With the loop closed as shown in the diagrams, we are said to be in automatic mode and the controller is making all adjustments to the FCE. If we were to open the loop and switch to manual mode, then we would be able to issue CO commands through buttons or a keyboard directly to the FCE. Hence:
• open loop = manual mode
• closed loop = automatic mode
Cruise Control and Measuring Our PV
Cruise control in a car is a reasonably common intermediate value control system. For those who are unfamiliar with cruise control, here is how it works.
We first enable the control system with a button on the car instrument panel. Once on the open road and at our desired cruising speed, we press a second button that switches the controller from manual mode (where car speed is adjusted by our foot) to automatic mode (where car speed is adjusted by the controller).
The speed of the car at the moment we close the loop and switch from manual to automatic becomes the set point. The controller then continually computes and transmits corrective actions to the gas pedal (throttle) to maintain measured speed at set point.
It is often cheaper and easier to measure and control a variable directly related to the process variable of interest. This idea is central to control system design and maintenance. And this is why the loop diagrams above distinguish between our “process variable” and our “measured PV signal.”
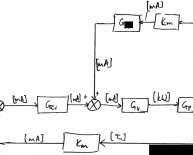
Cruise control serves to illustrate this idea. Actual car speed is challenging to measure. But transmission rotational speed can be measured reliably and inexpensively. The transmission connects the engine to the wheels, so as it spins faster or slower, the car speed directly increases or decreases.
Thus, we attach a small magnet to the rotating output shaft of the car transmission and a magnetic field detector (loops of wire and a simple circuit) to the body of the car above the magnet. With each rotation, the magnet passes by the detector and the event is registered by the circuitry as a “click.” As the drive shaft spins faster or slower, the click rate and car speed increase or decrease proportionally.
So a cruise control system really adjusts fuel flow rate to maintain click rate at the set point value. With this knowledge, we can organize cruise control into the essential design elements:
▪ Control Objective: maintain car speed at SP in spite of disturbances
▪ Process Variable: car speed
▪ Measurement Sensor: magnet and coil to clock drive shaft rotation
▪ Measured Process Variable (PV) Signal: “click rate” signal from the magnet and coil
▪ Set Point (SP): desired car speed, recast in the controller as a desired click rate
▪ Controller Output (CO): signal to actuator that adjusts gas pedal (throttle)
▪ Final Control Element (FCE): gas pedal position
▪ Manipulated Variable: fuel flow rate
Share this article
Related Posts
Latest Posts


